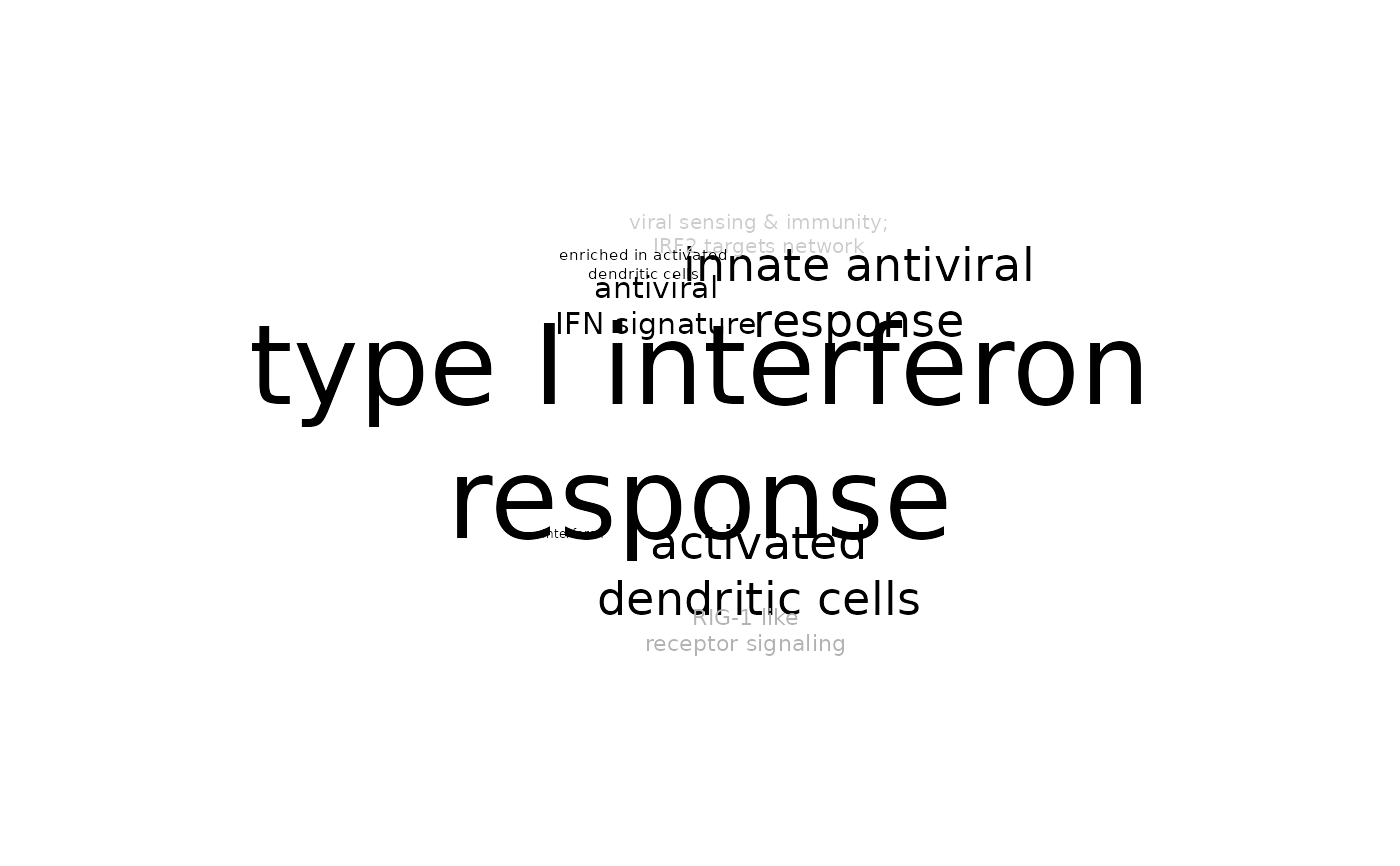
Tag cloud based on tmod results
tmodTagcloud.RdPlot a tag (word) cloud based on results from tmod enrichment.
Usage
tmodTagcloud(
  results,
  filter = TRUE,
  simplify = TRUE,
  tag.col = "Title",
  min.auc = 0.5,
  max.qval = 0.05,
  plot = TRUE,
  weights.col = "auto",
  pval.col = "P.Value",
  maxn = NULL,
  ...
)
Arguments
- results
data frame produced by one of the tmod enrichment tests
- filter
Whether redundant and not annotated modules should be removed
- simplify
Whether module names should be simplified
- tag.col
Which column from results should be used as tags on the plot
- min.auc
Minimal AUC to show (default: 0.5)
- max.qval
Maximal adjusted p value to show (default: 0.05)
- plot
Should the tag cloud be plotted or only returned
- weights.col
Which column from results should be used as weights for the tag cloud
- pval.col
Which column contains the P values which will be used to shade the tags
- maxn
Maximum number of gene set enrichment terms shown on the plot (if NULL – default – all terms will be shown)
- ...
Any further parameters are passed to the tagcloud function
Details
The tags will be generated based on results from tmod or any other suitable data frame. The data frame must contain two numeric columns, specified with "weights.col" and "pval.col", which will be used to calculate the size and shade of the tags, respectively. Furthermore, it has to contain a column with tags (parameter "tag.col", by default "Title").
Any data frame can be used as long as it contains the specified columns.
Examples
data(tmod)
fg <- getModuleMembers("LI.M127")[[1]]
bg <- tmod$gv
result <- tmodHGtest( fg, bg )
tmodTagcloud(result)
